
Changelog
Follow up on the latest improvements and updates.
RSS
new
Top Queries
Top Queries are a curated list of the most interesting and insightful queries associated with a table or a data product.
Instead of sifting through a large query log everytime to find useful queries, asset owners can pick queries, create explainers using AI (or manually) and mark them as Top Queries.
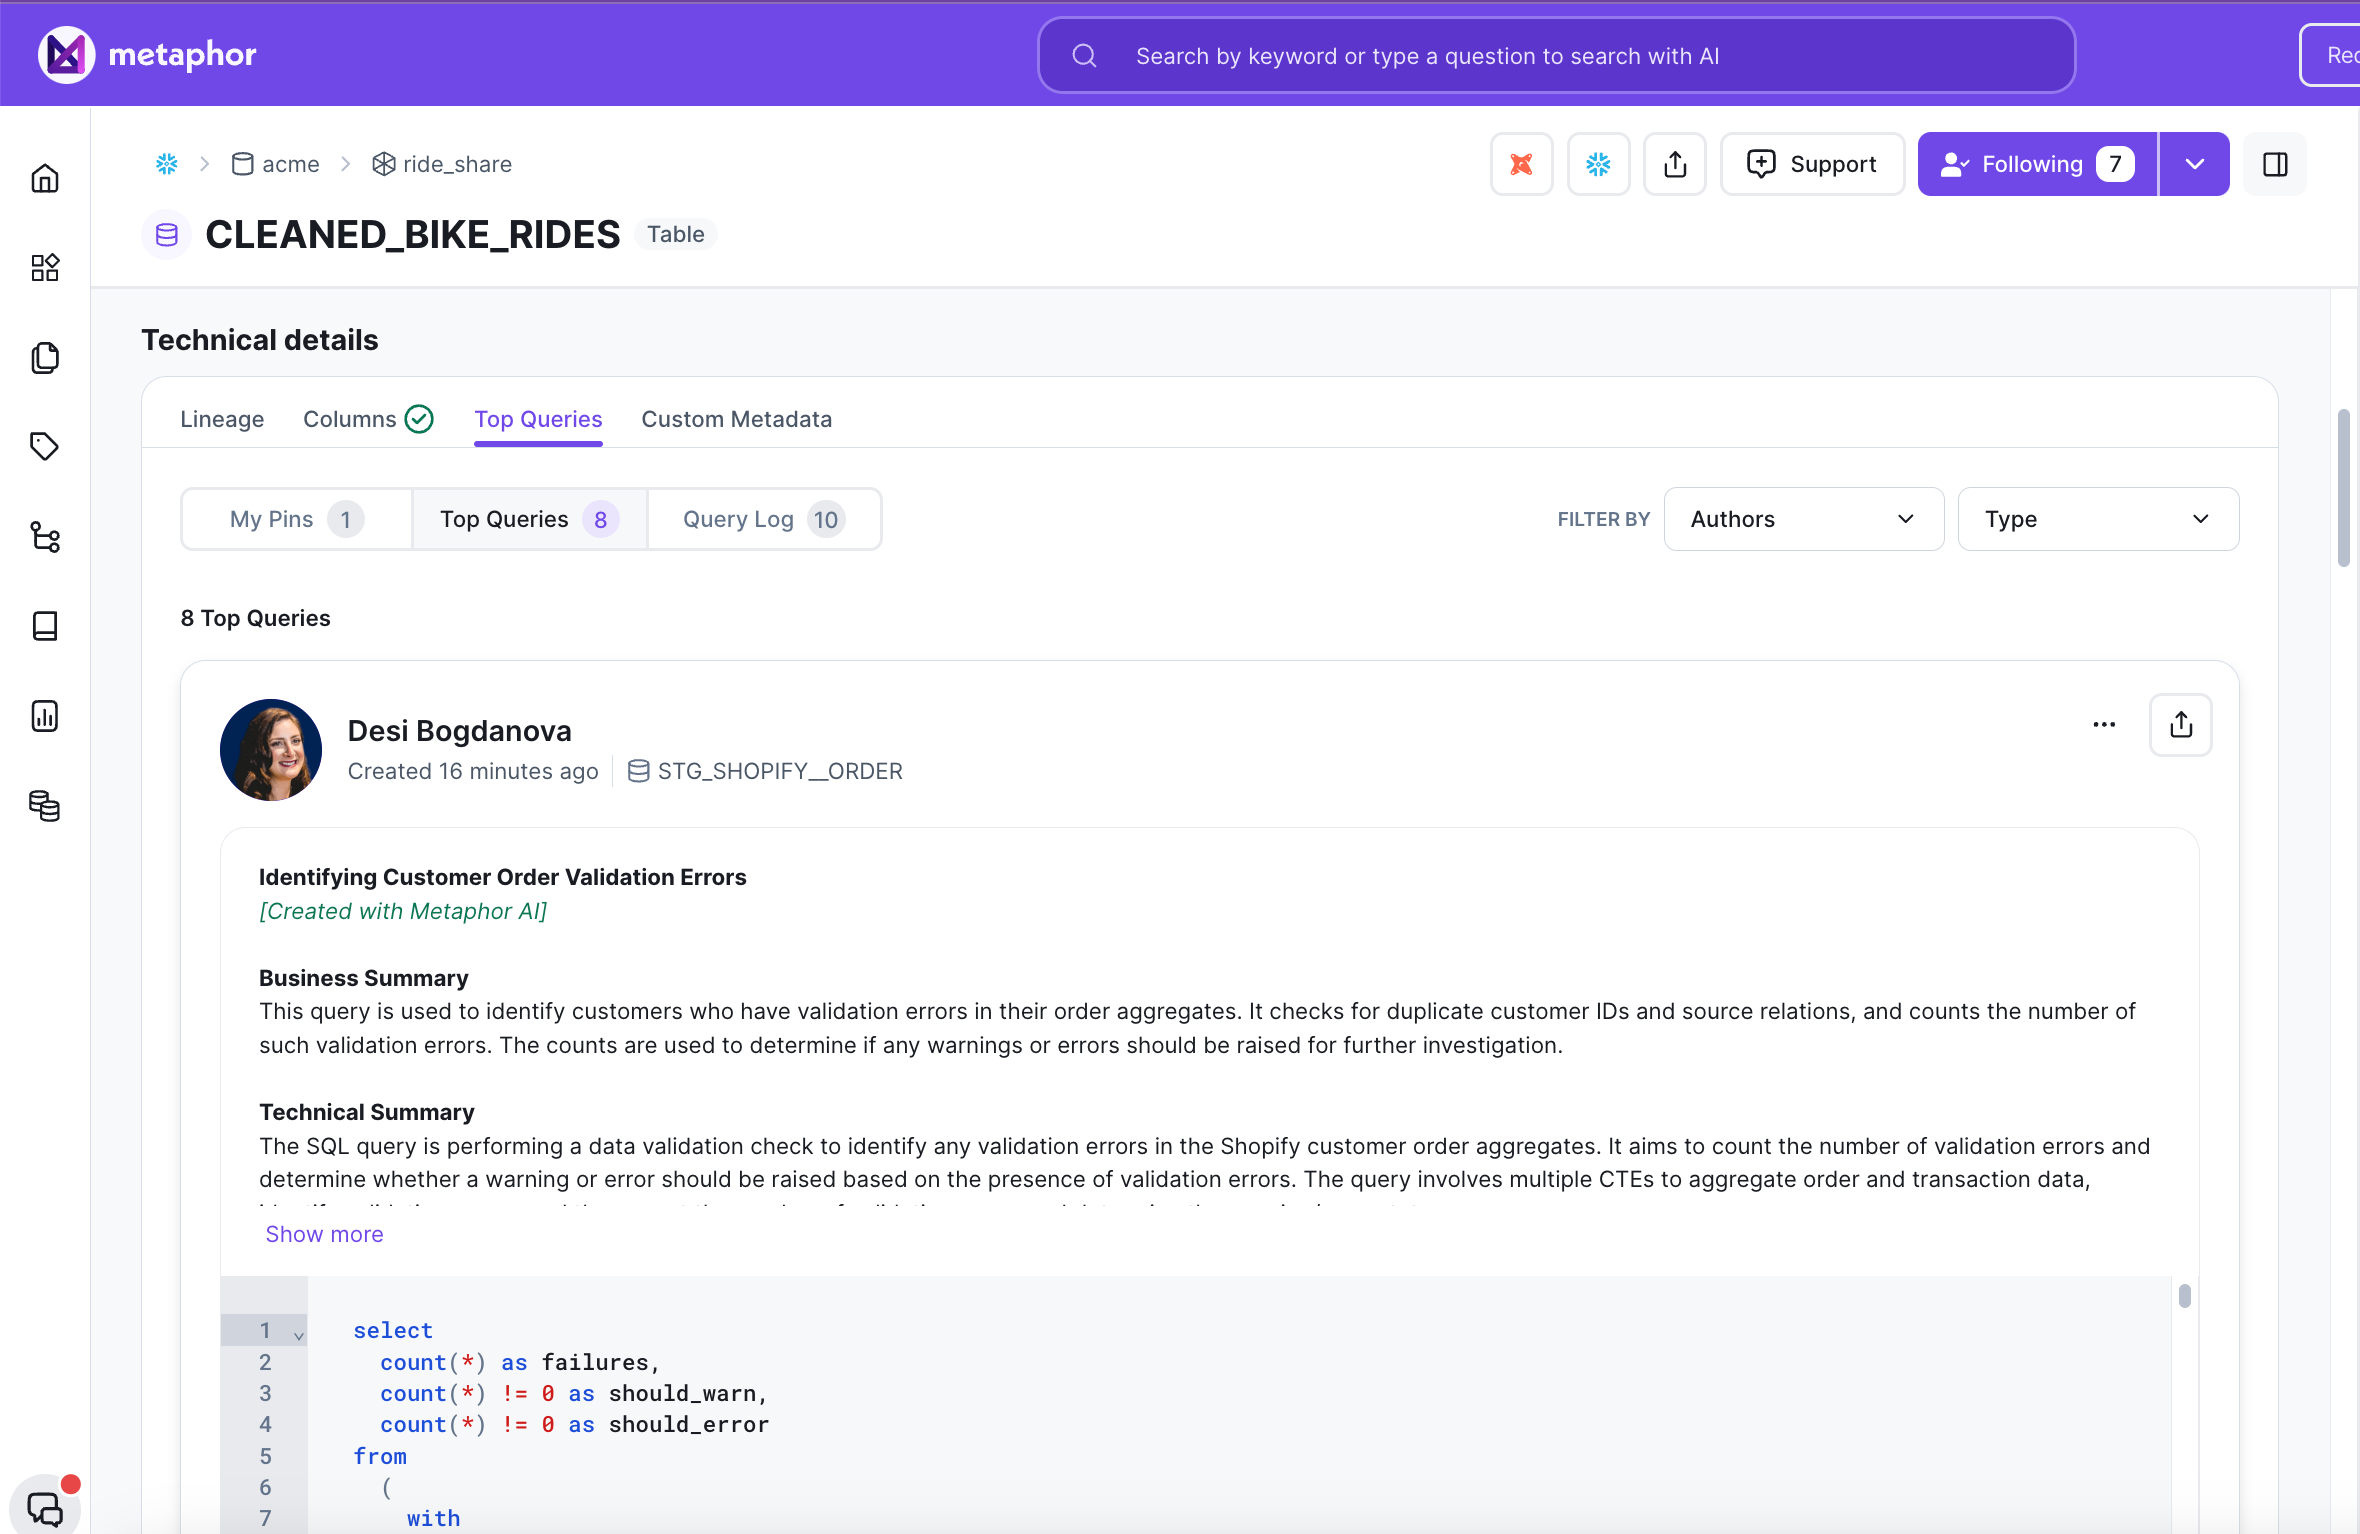
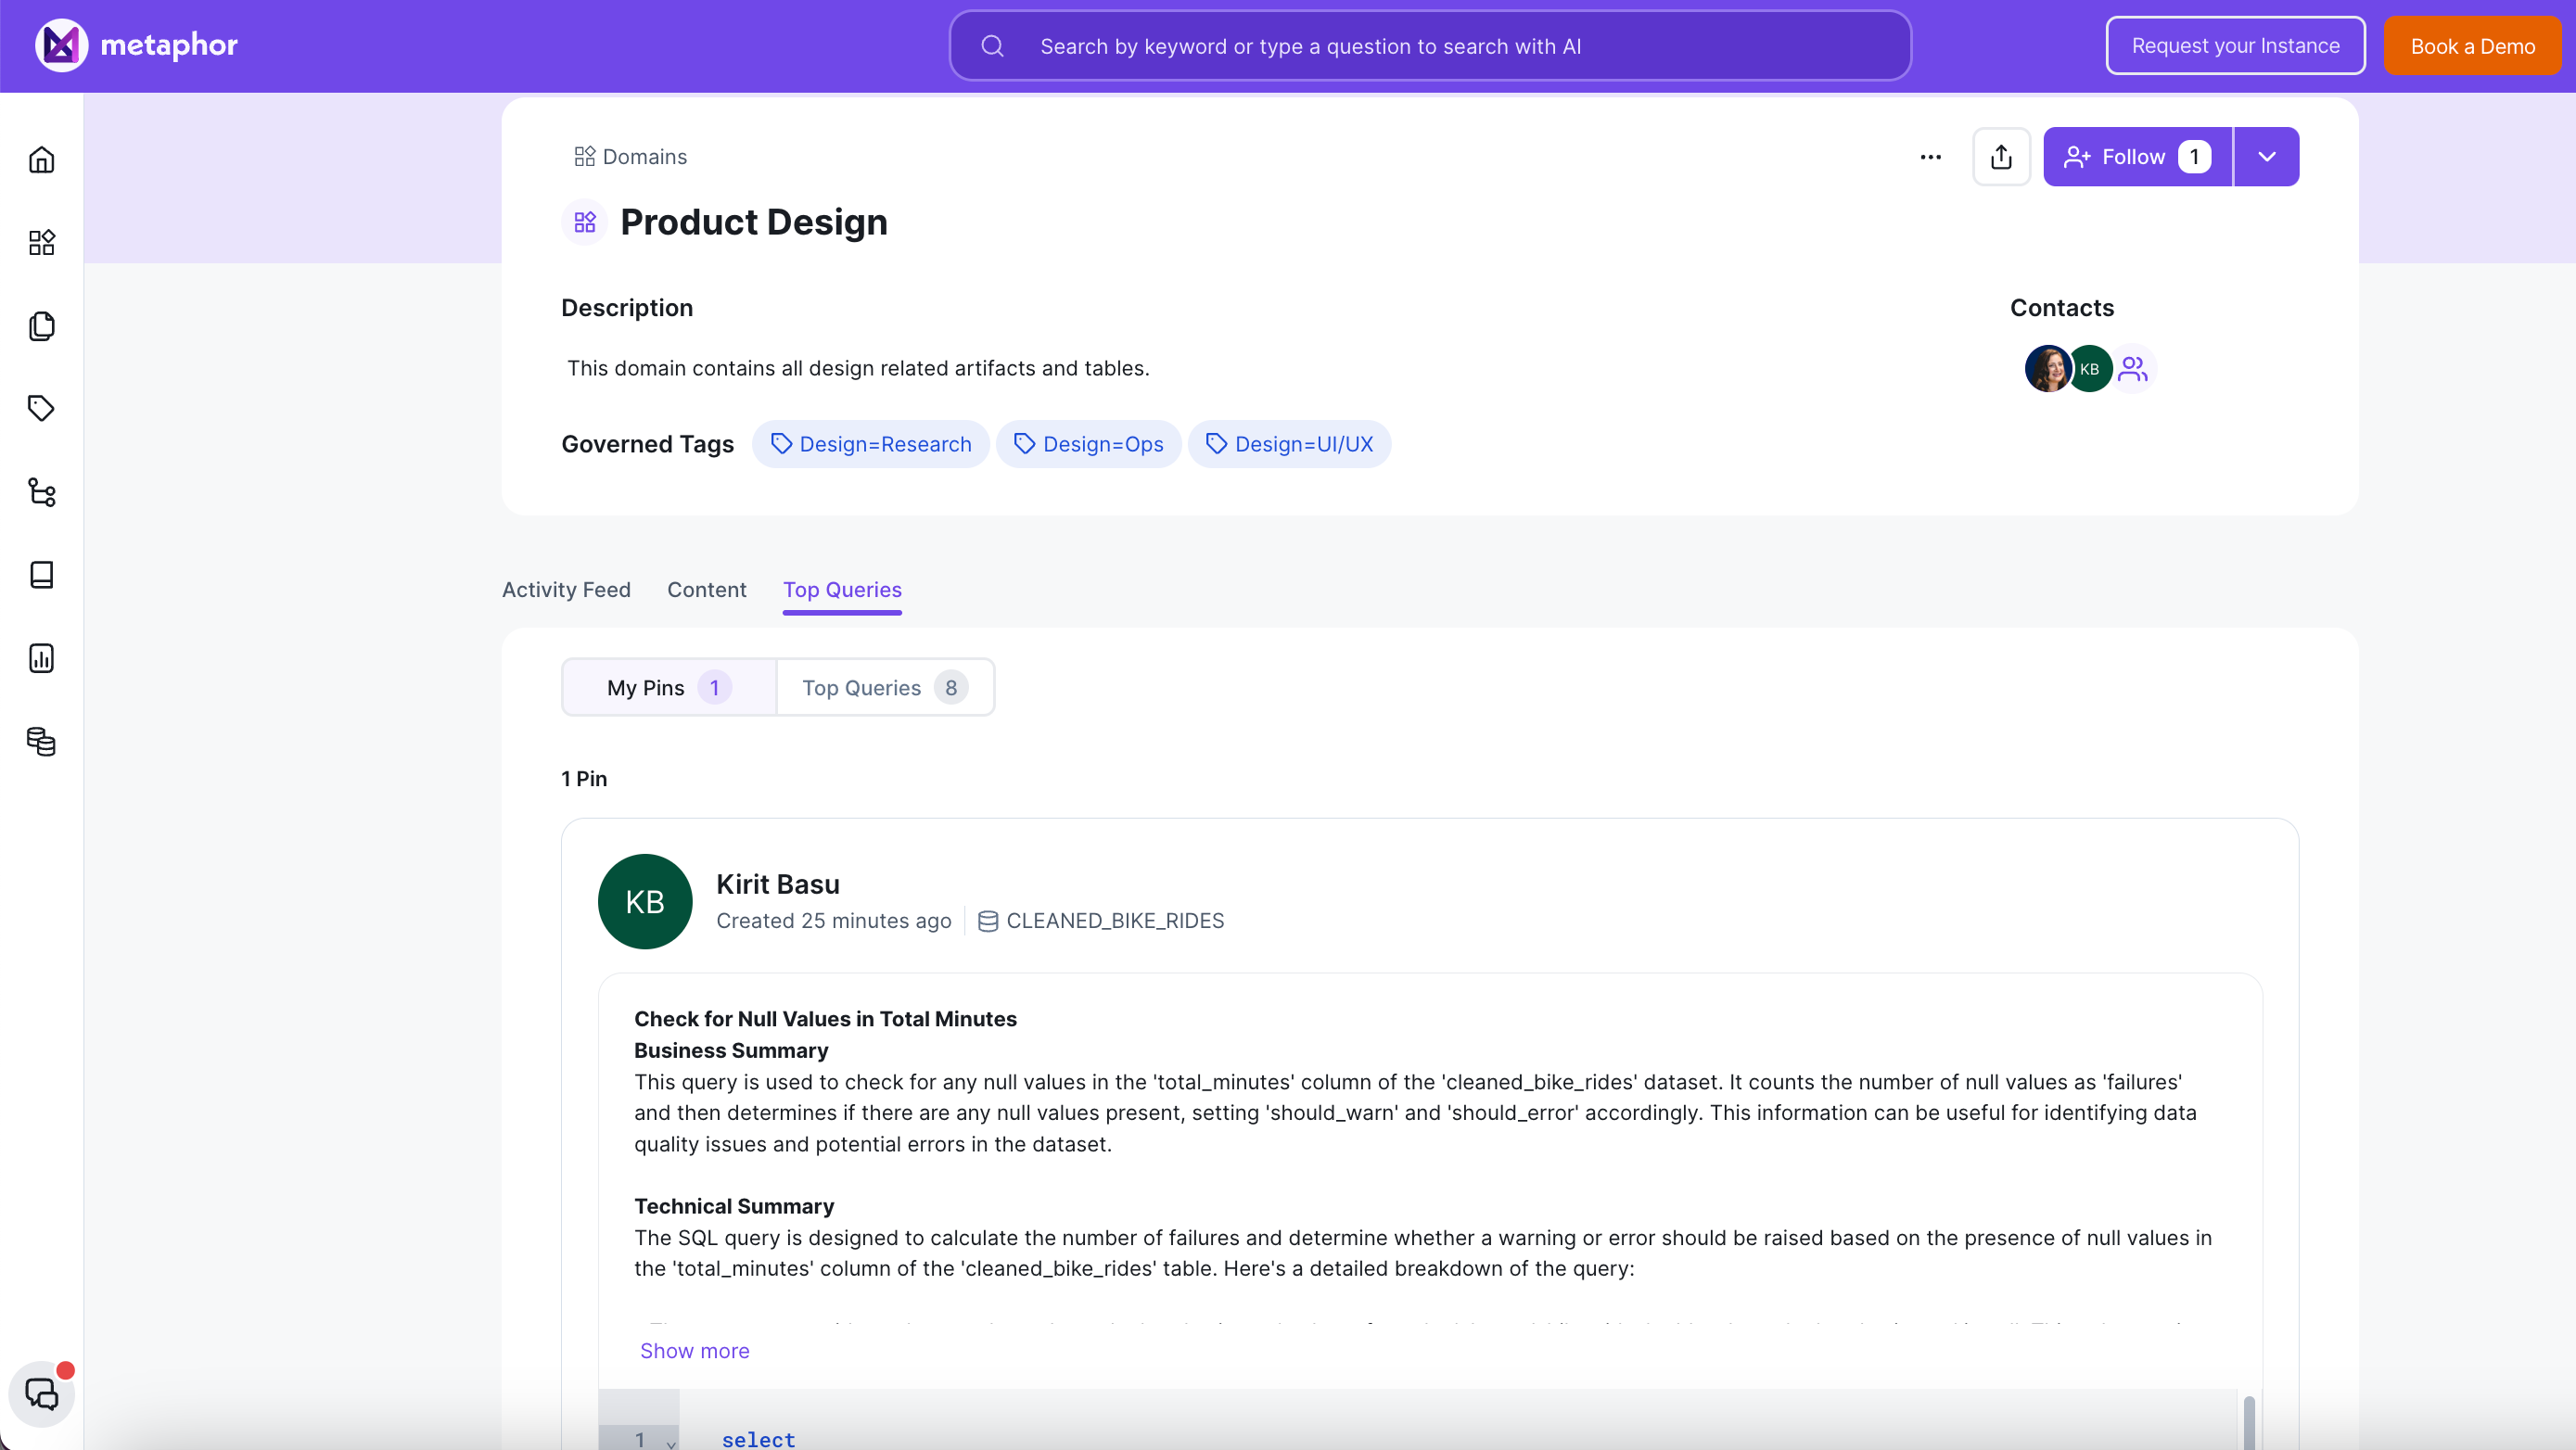
Top Queries show up at the level of an individual asset, or at a domain level.
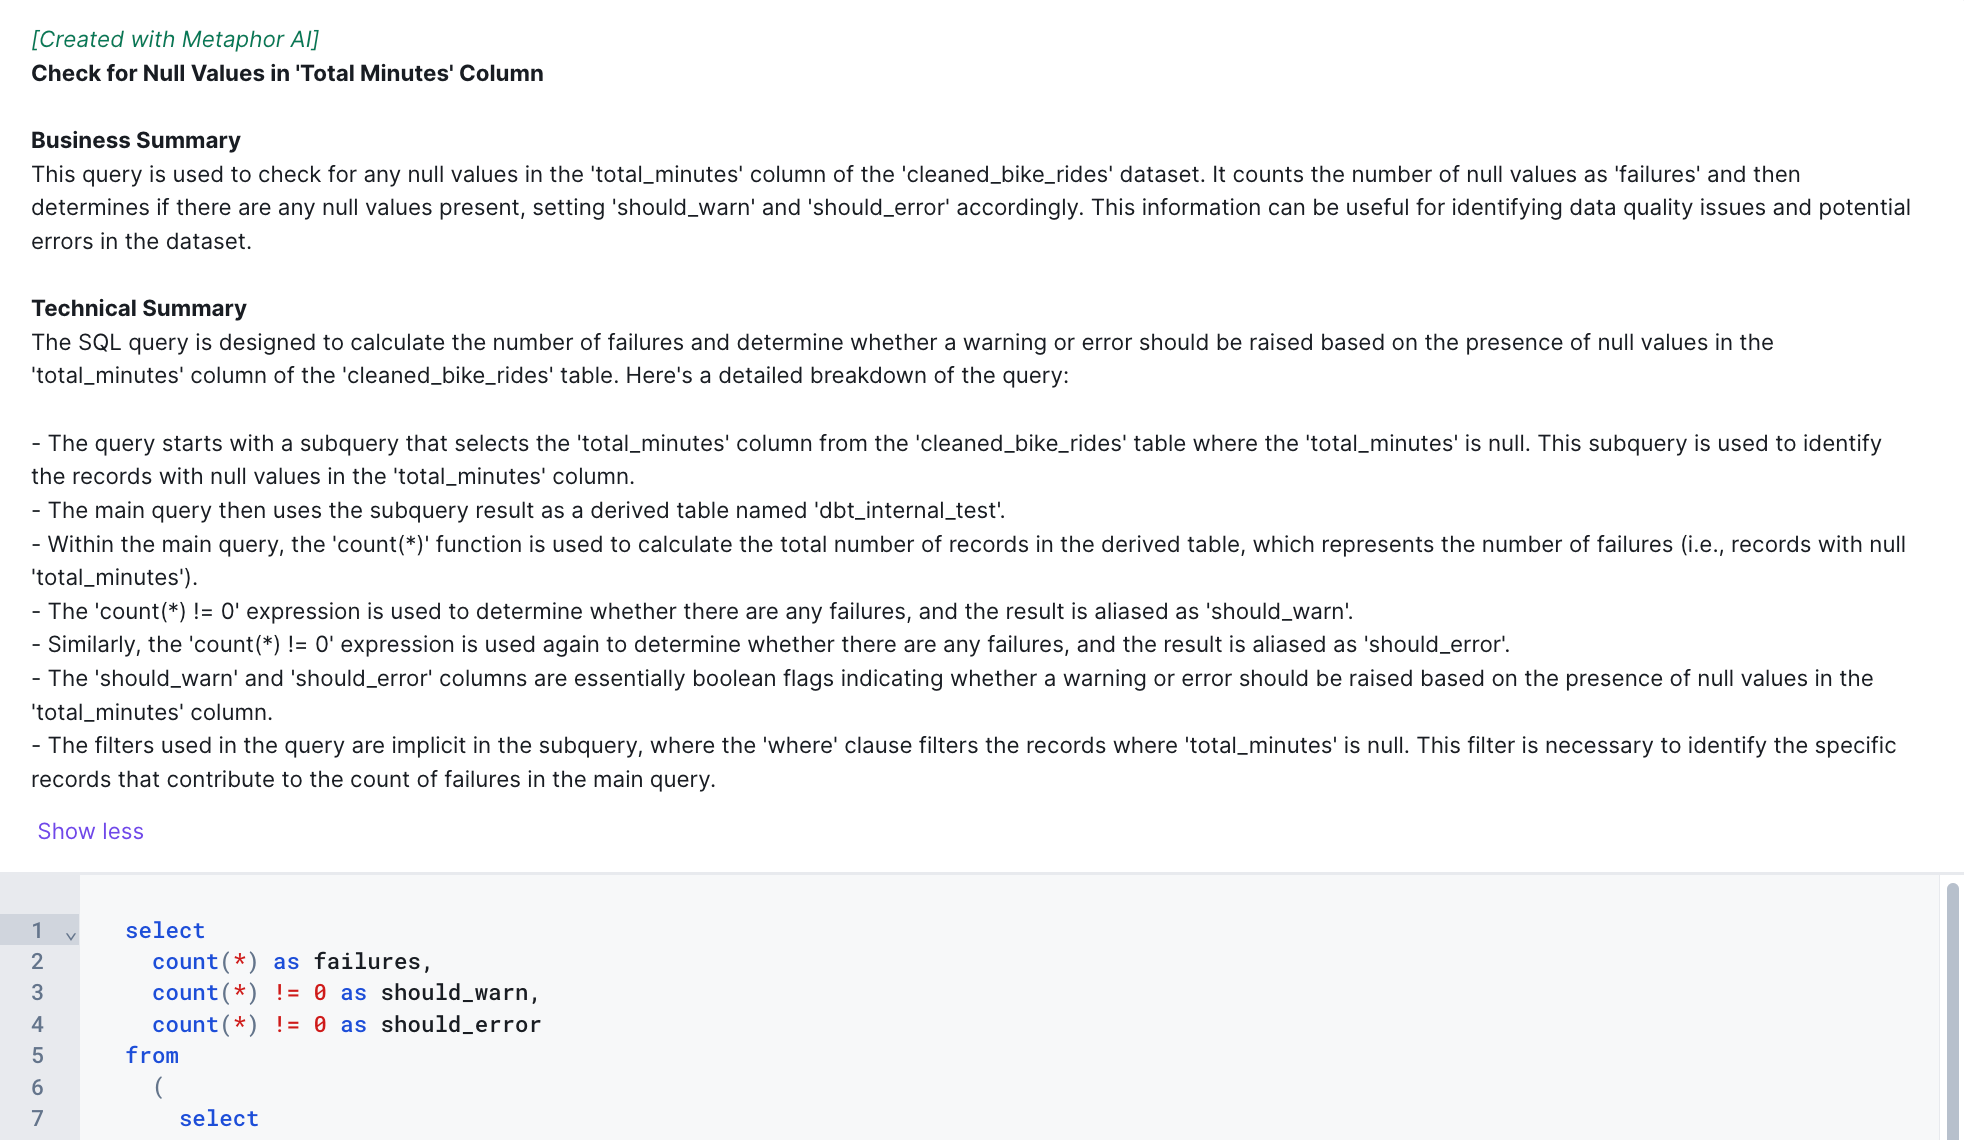
While browsing through a table's query log users can hit the 'Explain' button to get a detailed human readable explanation of that query.
Metaphor AI looks at context such as table/column descriptions and any related glossary terms and generates 2 summaries - A high level functional explanation that a business user may care about, and a deeper technical readout of the various logical steps of the code.
We've made several improvements to Metaphor Lineage to make it easier to navigate large and complex lineage graphs.
Full Screen Mode
Clicking the 'Open in full page' link
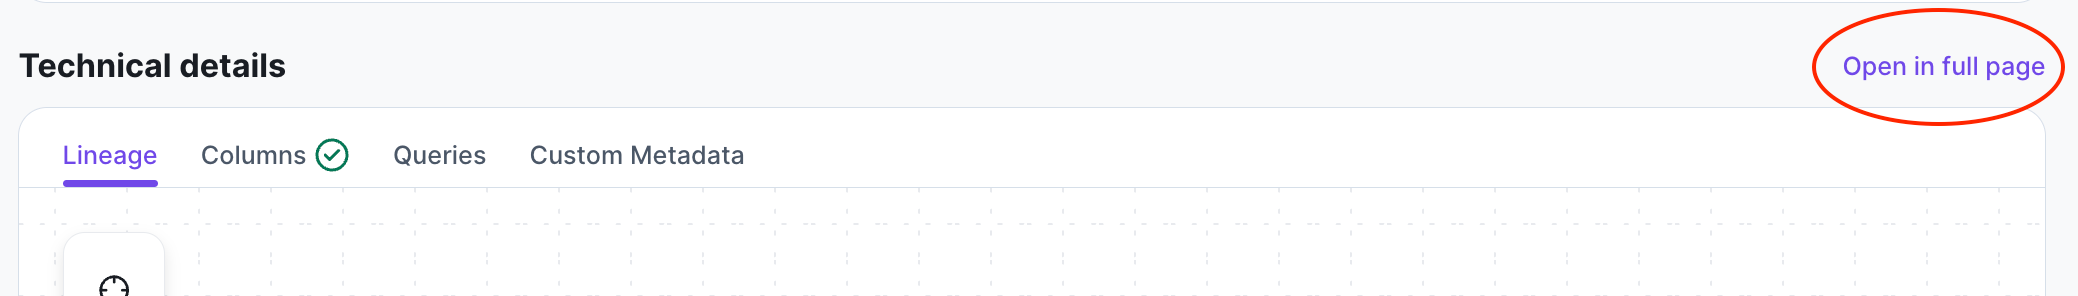
Lets you navigate the canvas using the full real-estate of your browser window.
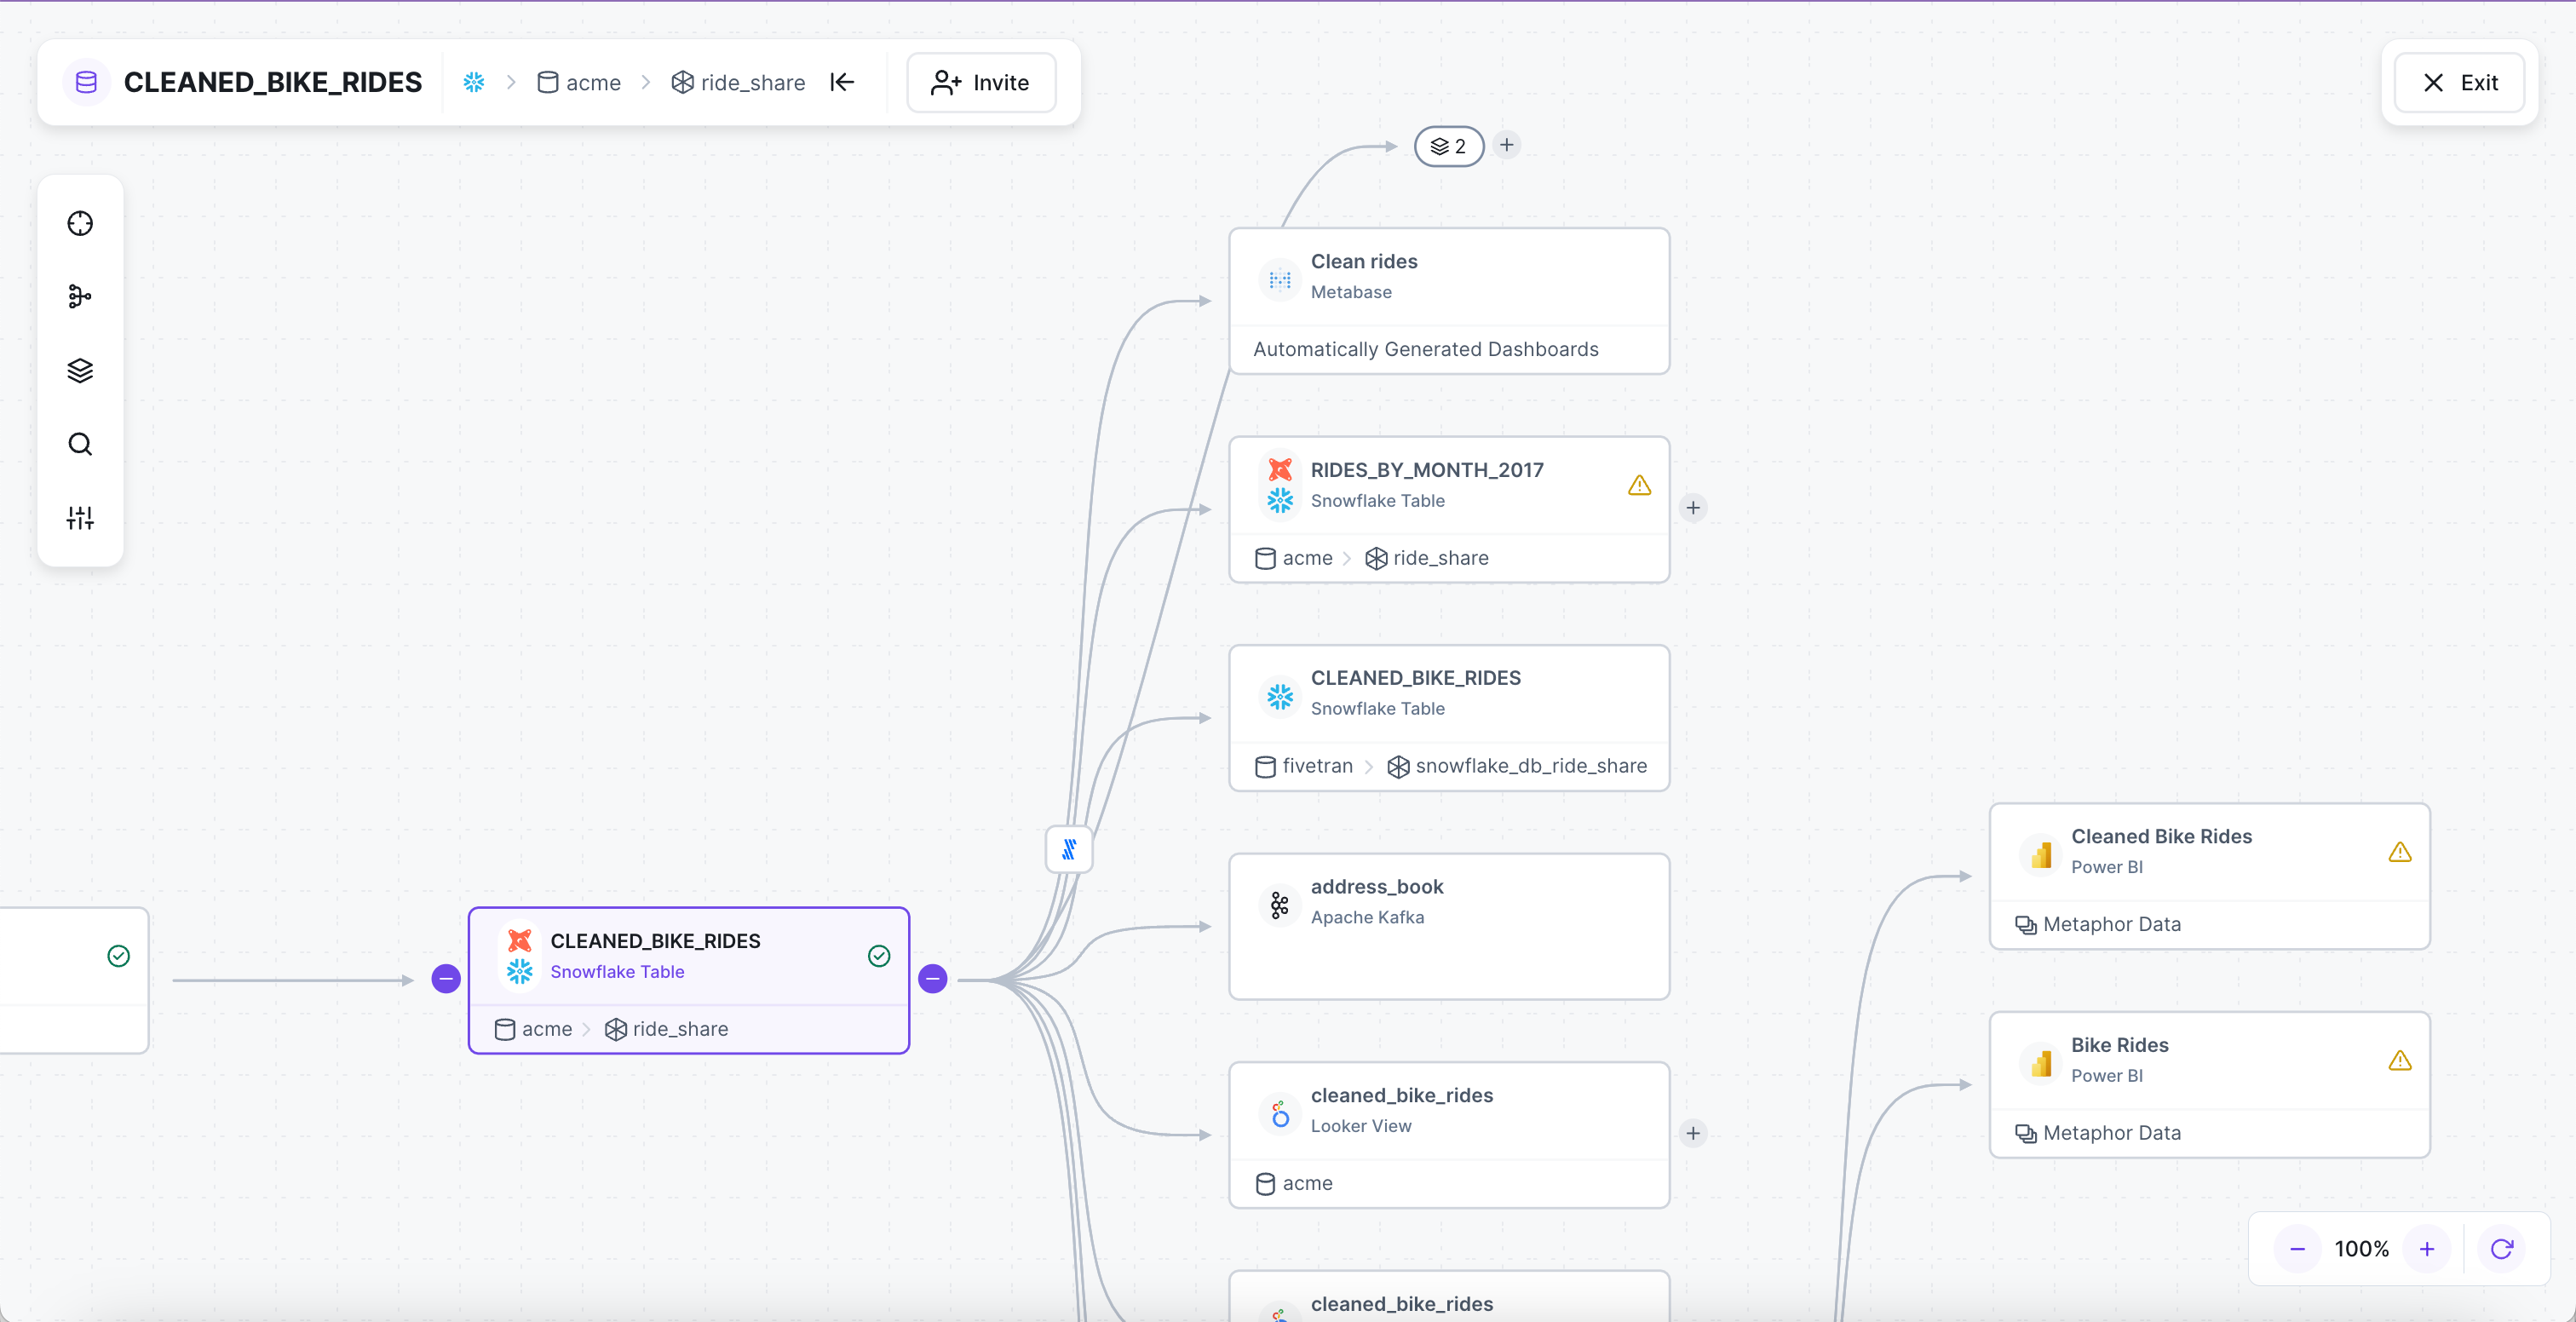
Hide Non-Prod/Incomplete/Deleted Assets
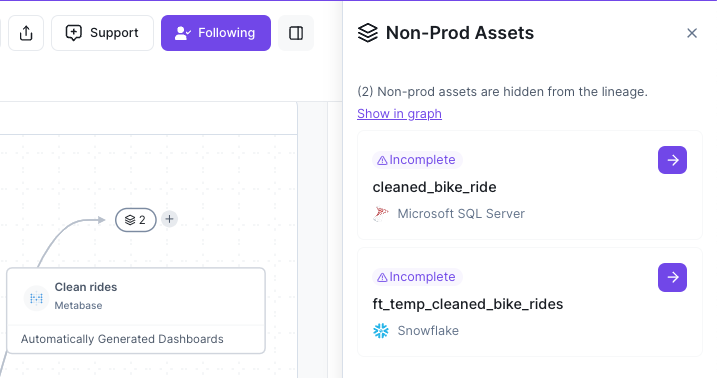
For customers that have a lot of non-prod assets e.g. tmp tables etc, the lineage default collapses these assets.

Selecting the collapsed node will display a list of those assets on the right hand side.
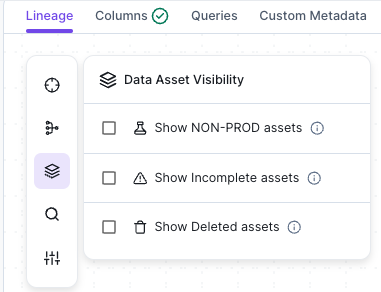
And if you'd like to see those nodes inside the graph you can choose the Data Asset Visibility option in the Overlay bar to enable them.
Show underlying query
Clicking on a node displays not only the underlying DDL query, but where applicable you can also see the dbt Source and Compiled query.
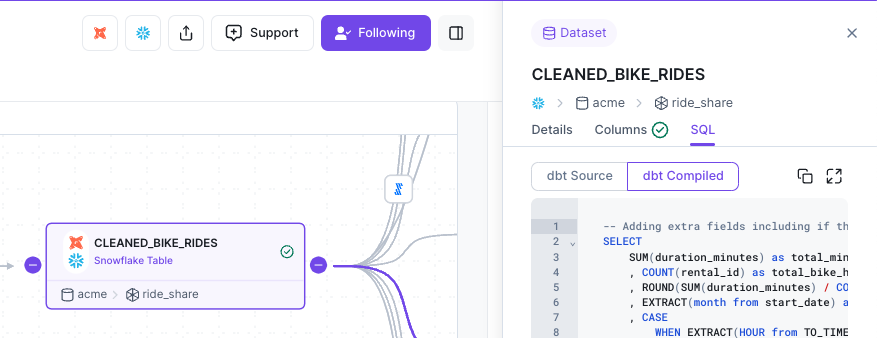
A similar query for SQL backed Tableau datasources also show up.
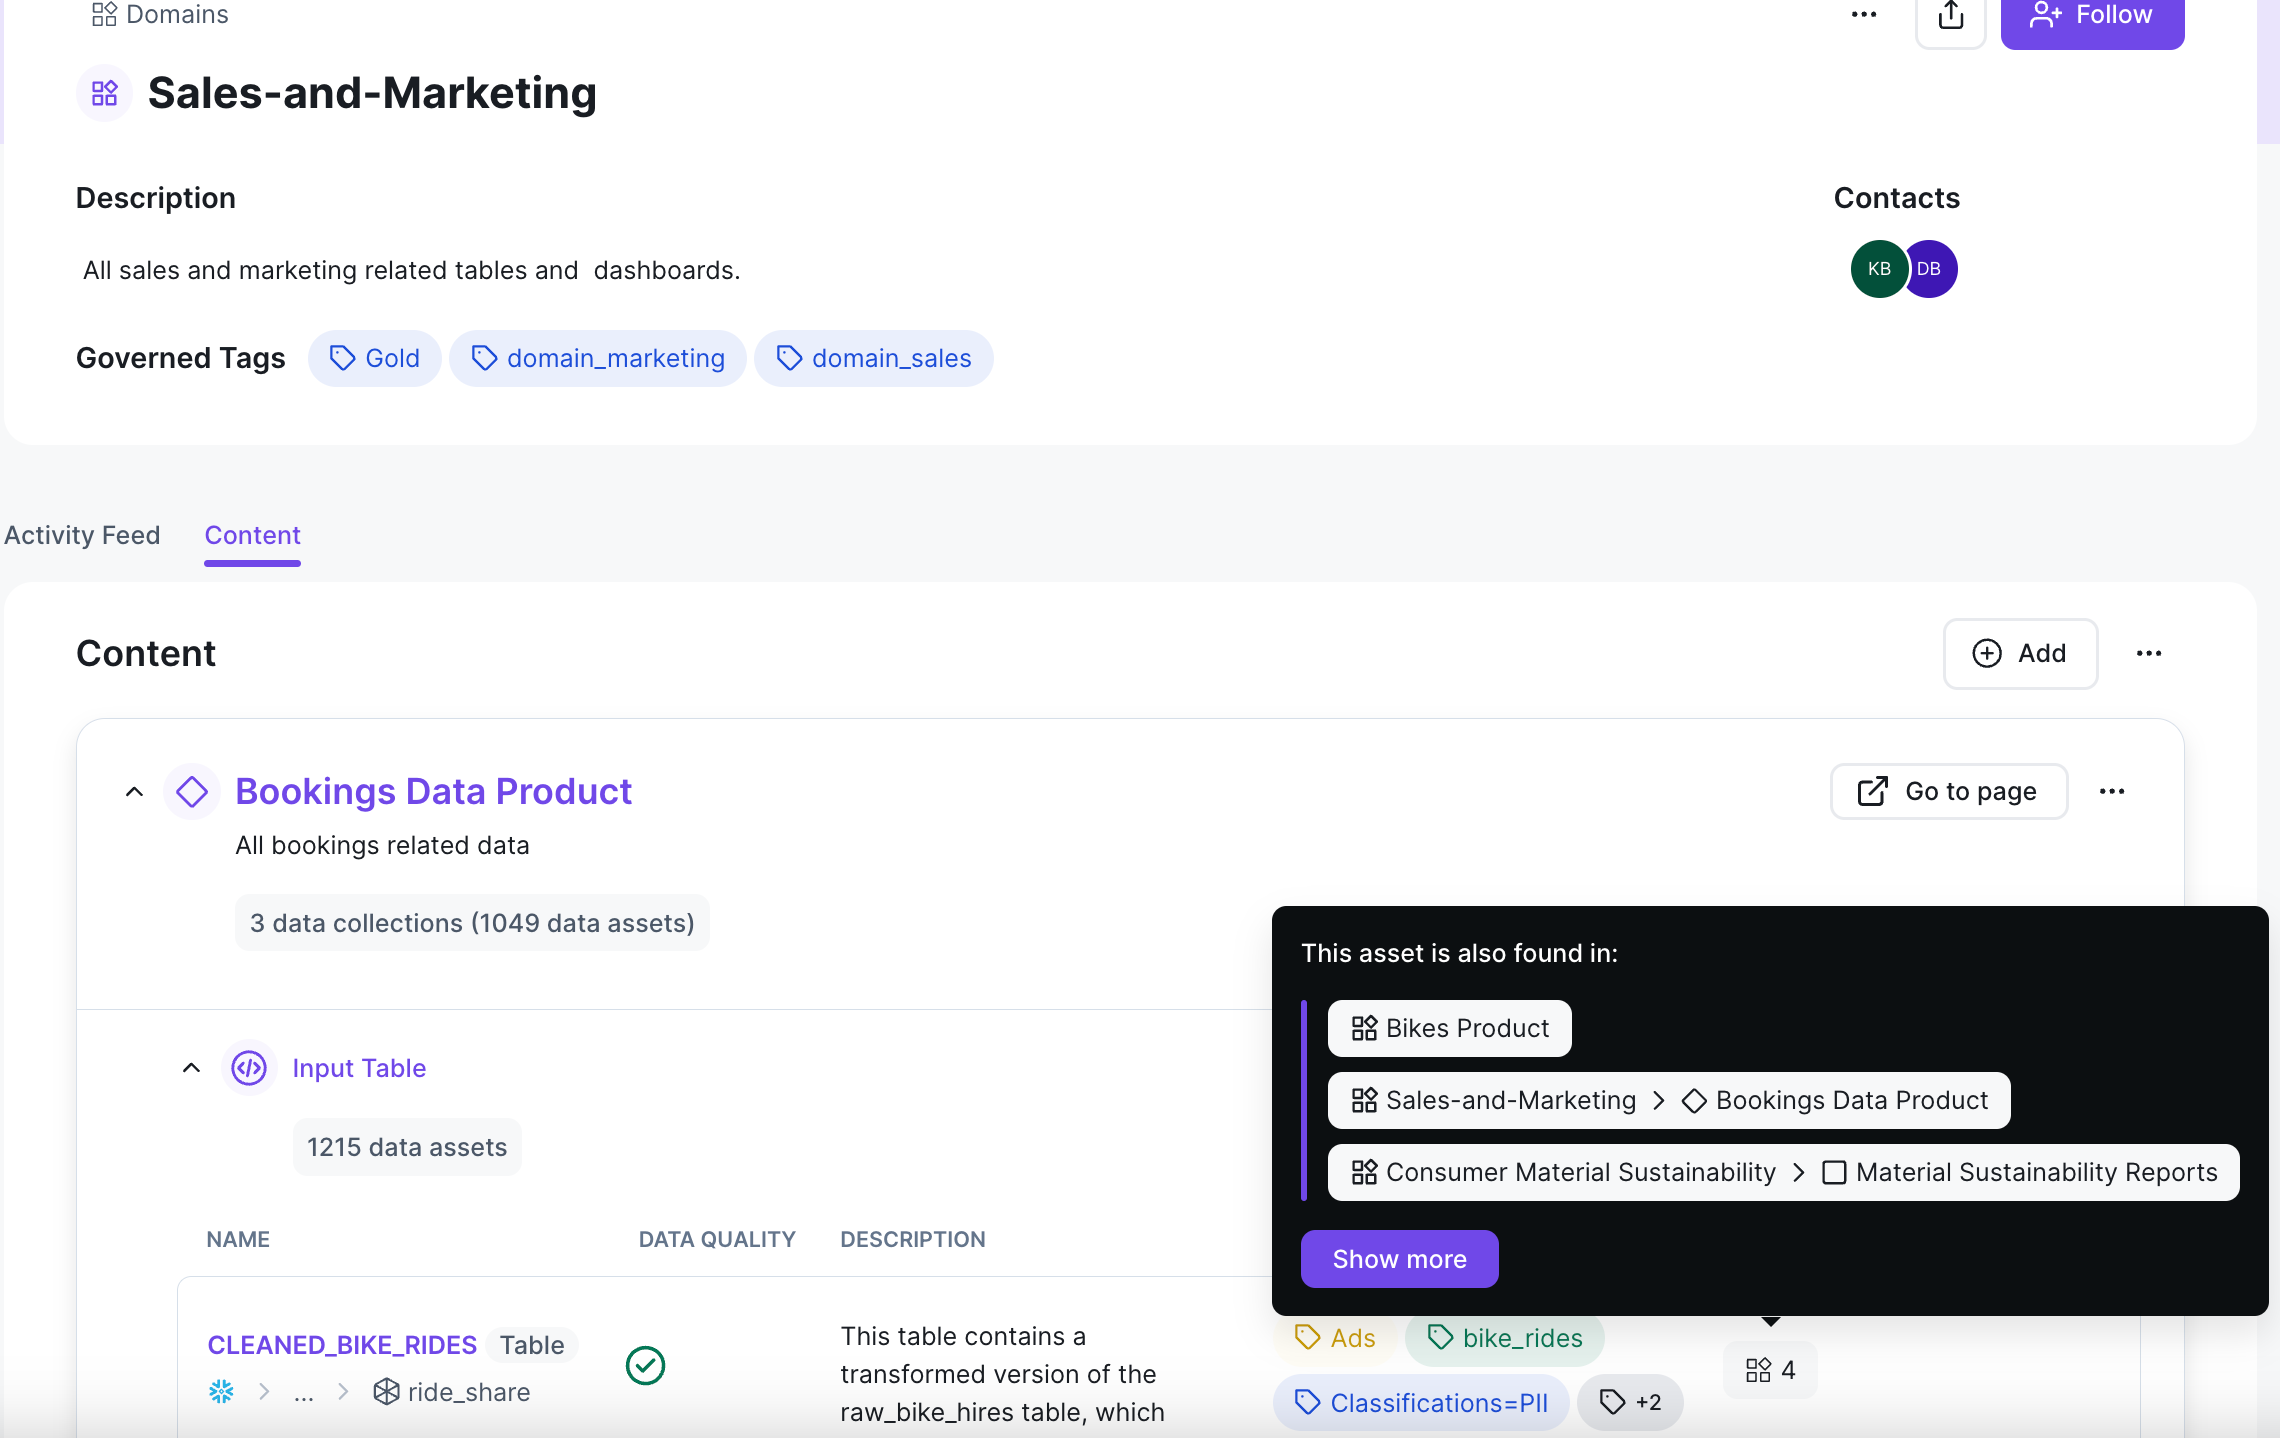
While browsing through assets in a domain, users can see other domains or data products a given asset is also used in.
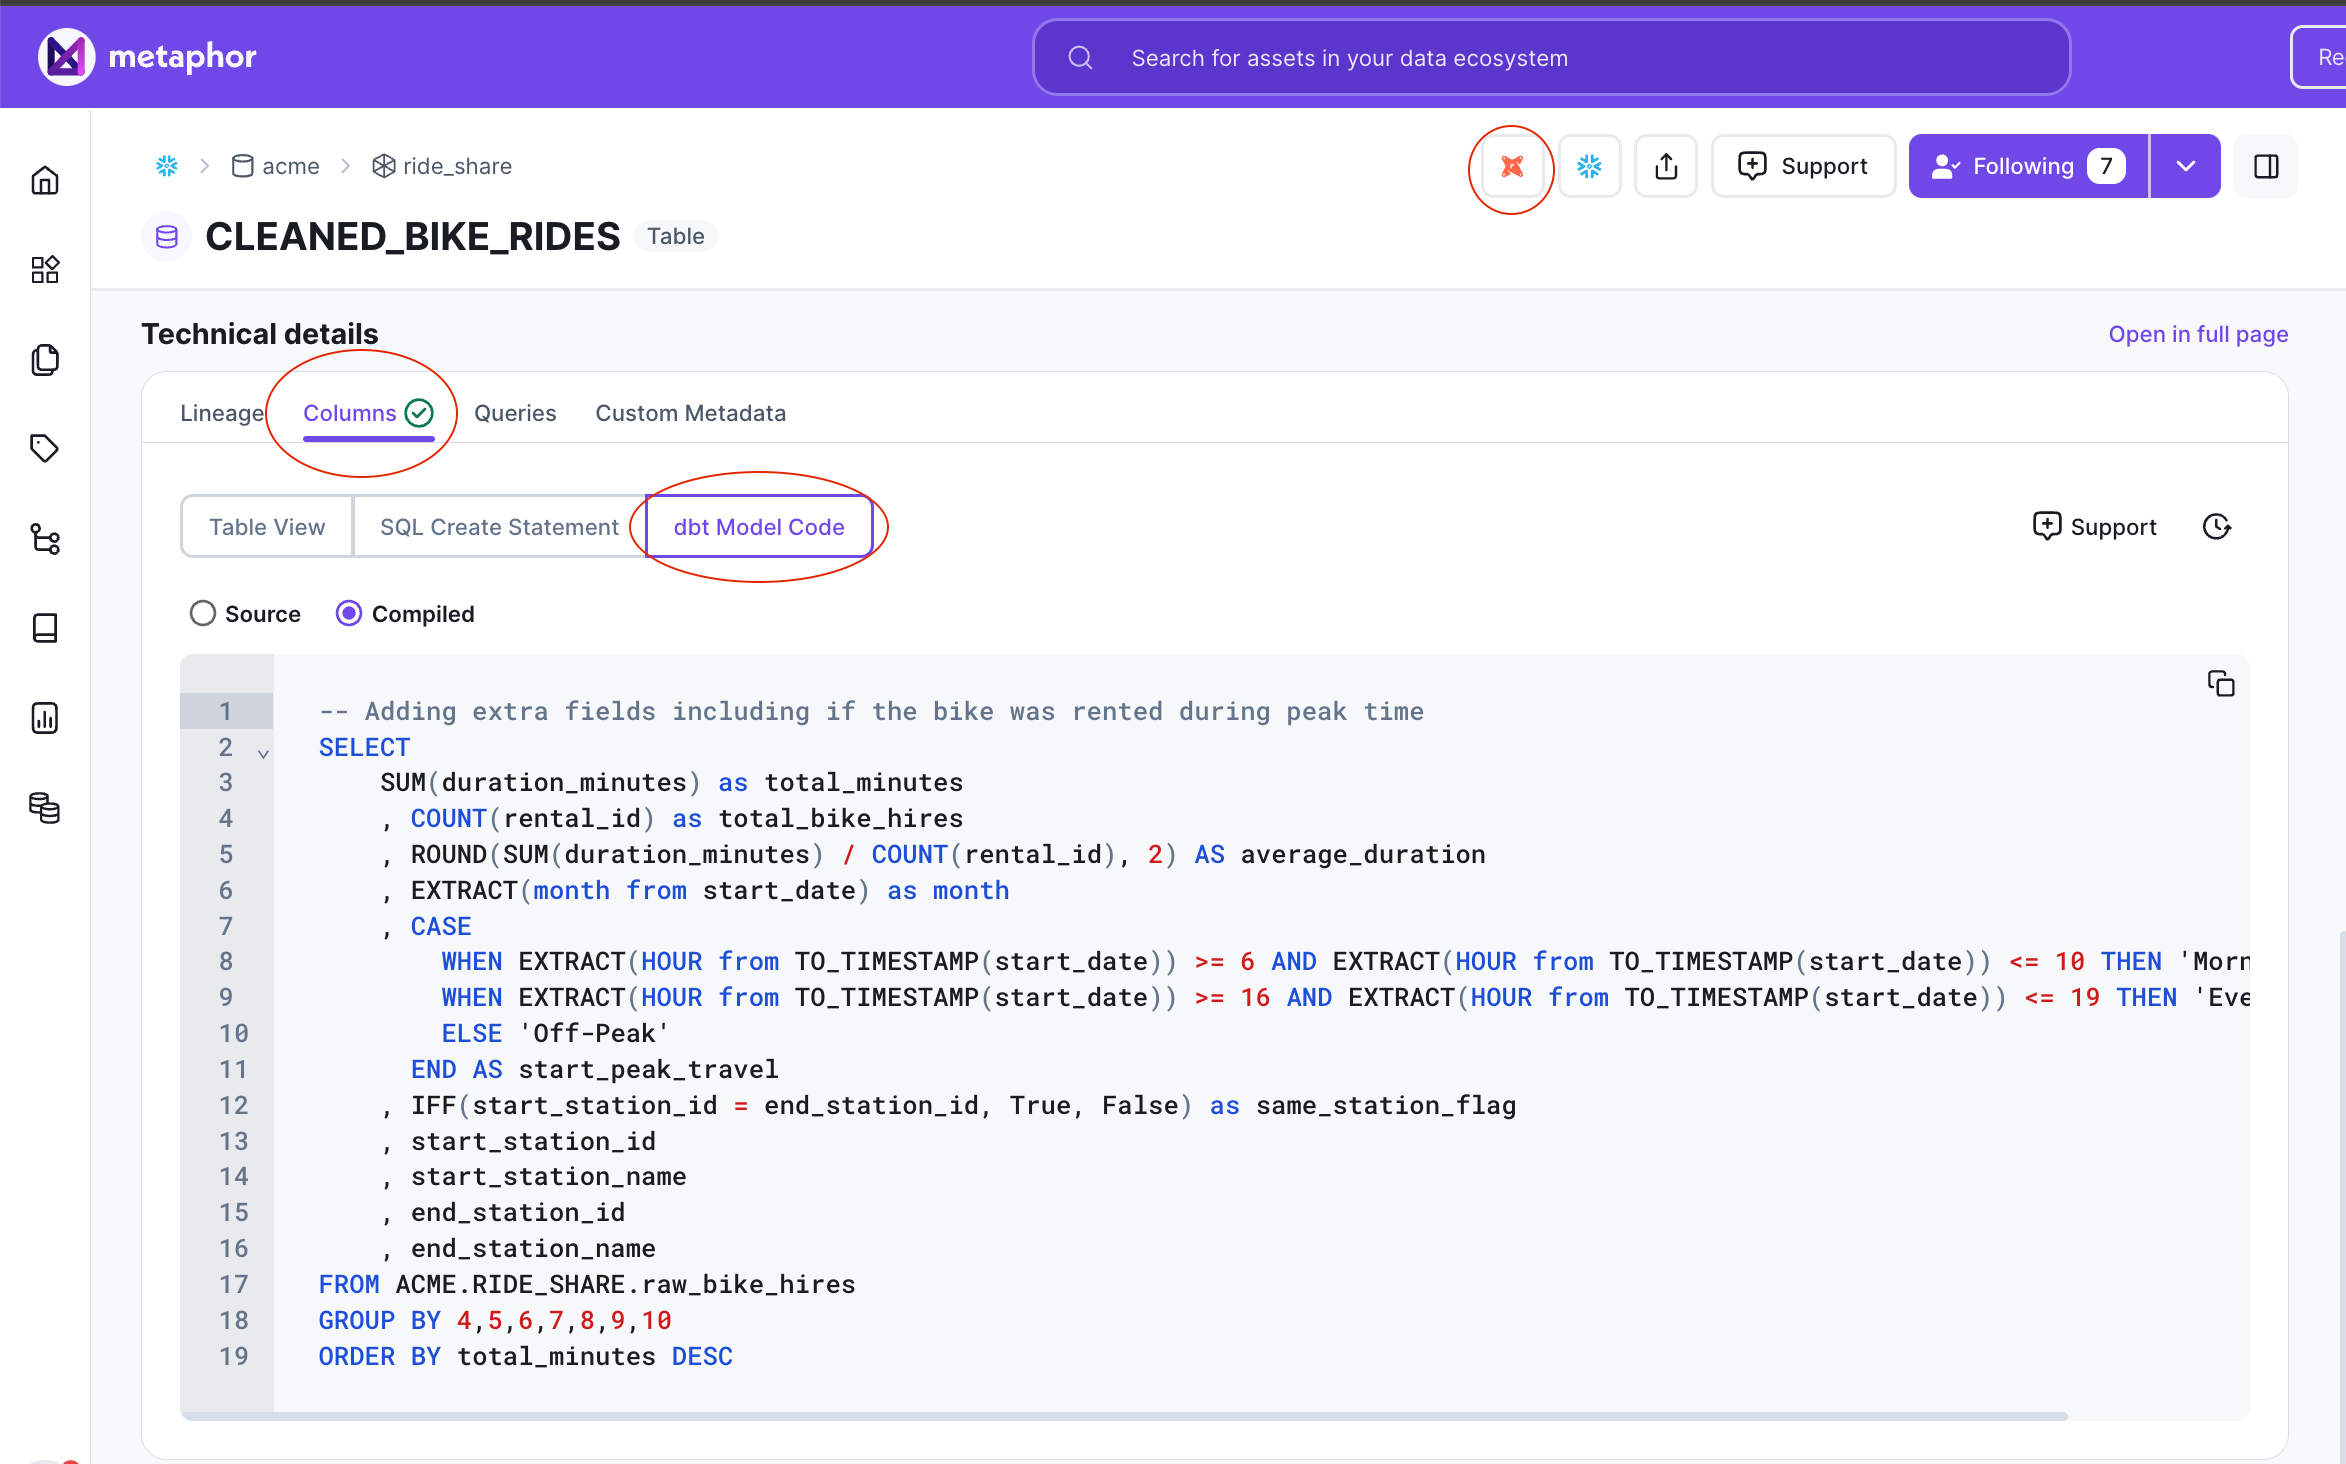
Users can now view the dbt Model code used to generate a table or view directly in the asset page.
Ofcourse users always have the option to click the dbt Icon and go to the dbt repo at any time.
We show both the actual dbt source code and the compiled version.
Note : If you don't see the compiled version make sure to run "dbt docs generate" as the last step of your dbt job. This is especially important if you run "dbt test", as the command is known to generate manifest.json without compiled code.
We've added a few search operators to help locate potentially stale assets quickly.
last_queried_before:YYYY-MM-DD
or last_queried_before:10d
Find dataset assets that were last queried before a certain absolute date or a particular number of days.
last_refreshed_before:YYYY-MM-DD
or last_refreshed_before:10d
Find dataset assets that were last refreshed (i.e. Last time the data in the table or view was changed due to a DML call (e.g. Insert, Update, etc.) ) before a certain absolute date or a particular number of days.
created_before:YYYY-MM-DD
or created_before:10d
Find dataset assets that were created before a certain absolute date or a particular number of days.
These operators can be chained to narrow down the selection.
For example, to find all assets within the acme database that were created a year ago but haven't been queried in the last 30 days - use the query :
database:acme created_before:365d last_queried_before:30d
Note
: created_before
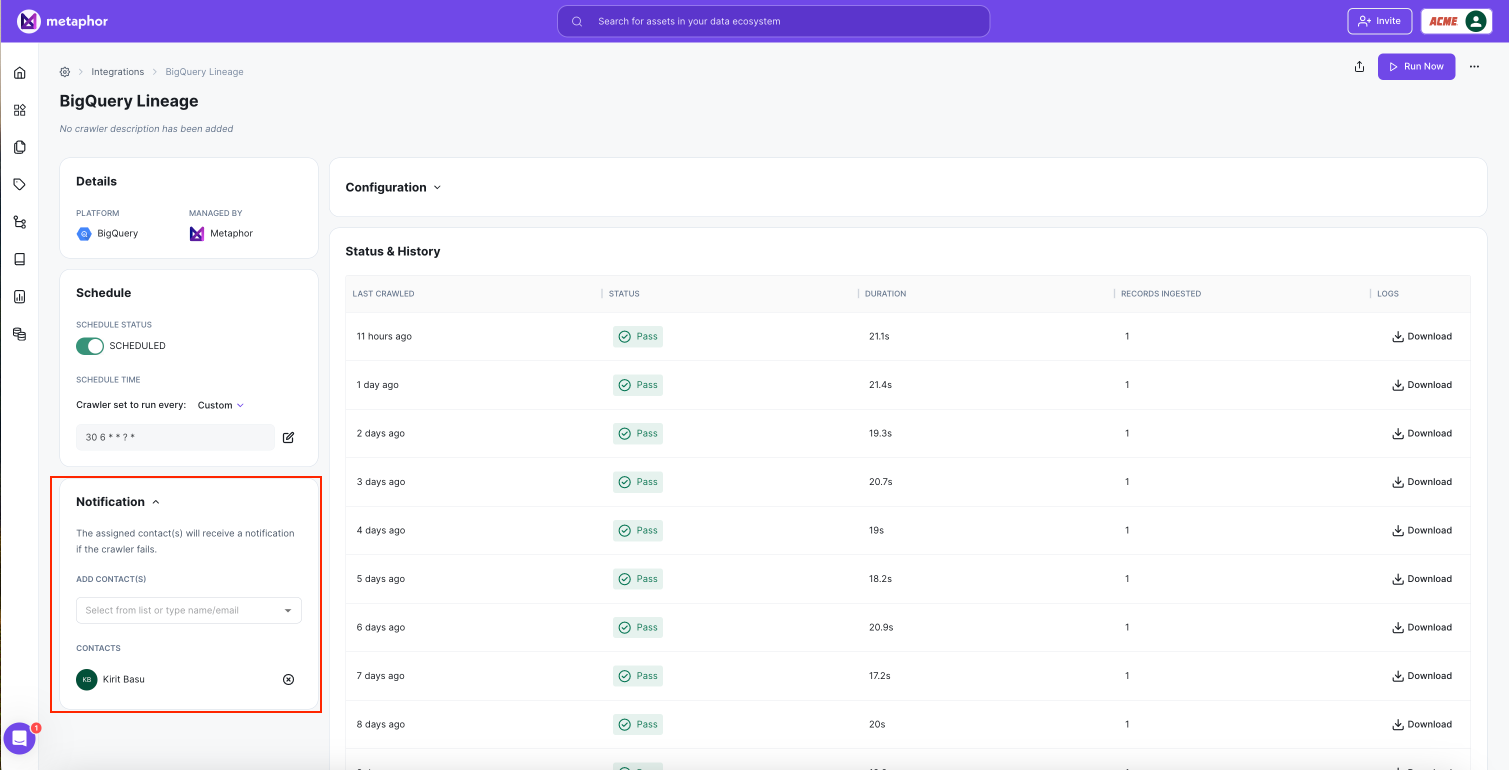
is only supported for Snowflake, Bigquery and Databricks Unity Catalog.Administrators can now subscribe to be notified by email if a crawler fails for any reason.
Metaphor now has new crawlers for :
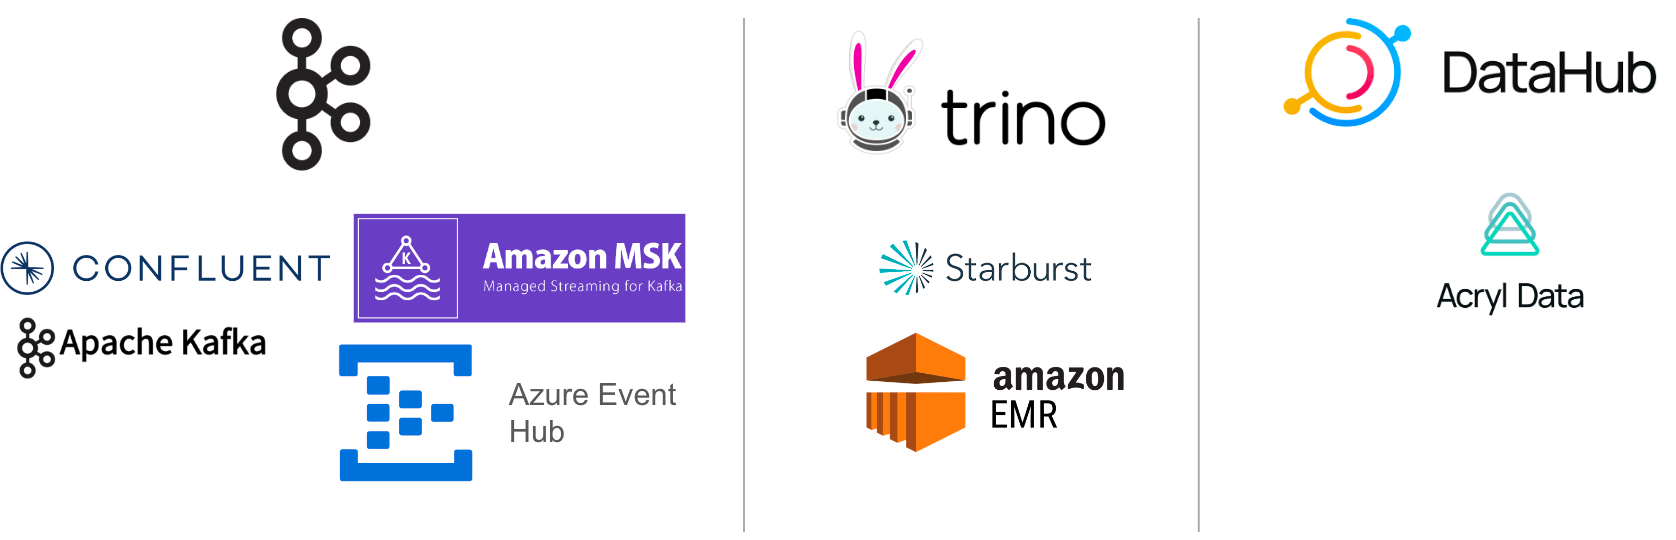
Kafka
Get Kafka metadata out of any Kafka compliant API
Trino
Get metadata from your Trino instance - onprem, using Startburst or AWS EMR
Import metadata from DataHub/Acryl
One click solution to migrate metadata out of legacy solutions
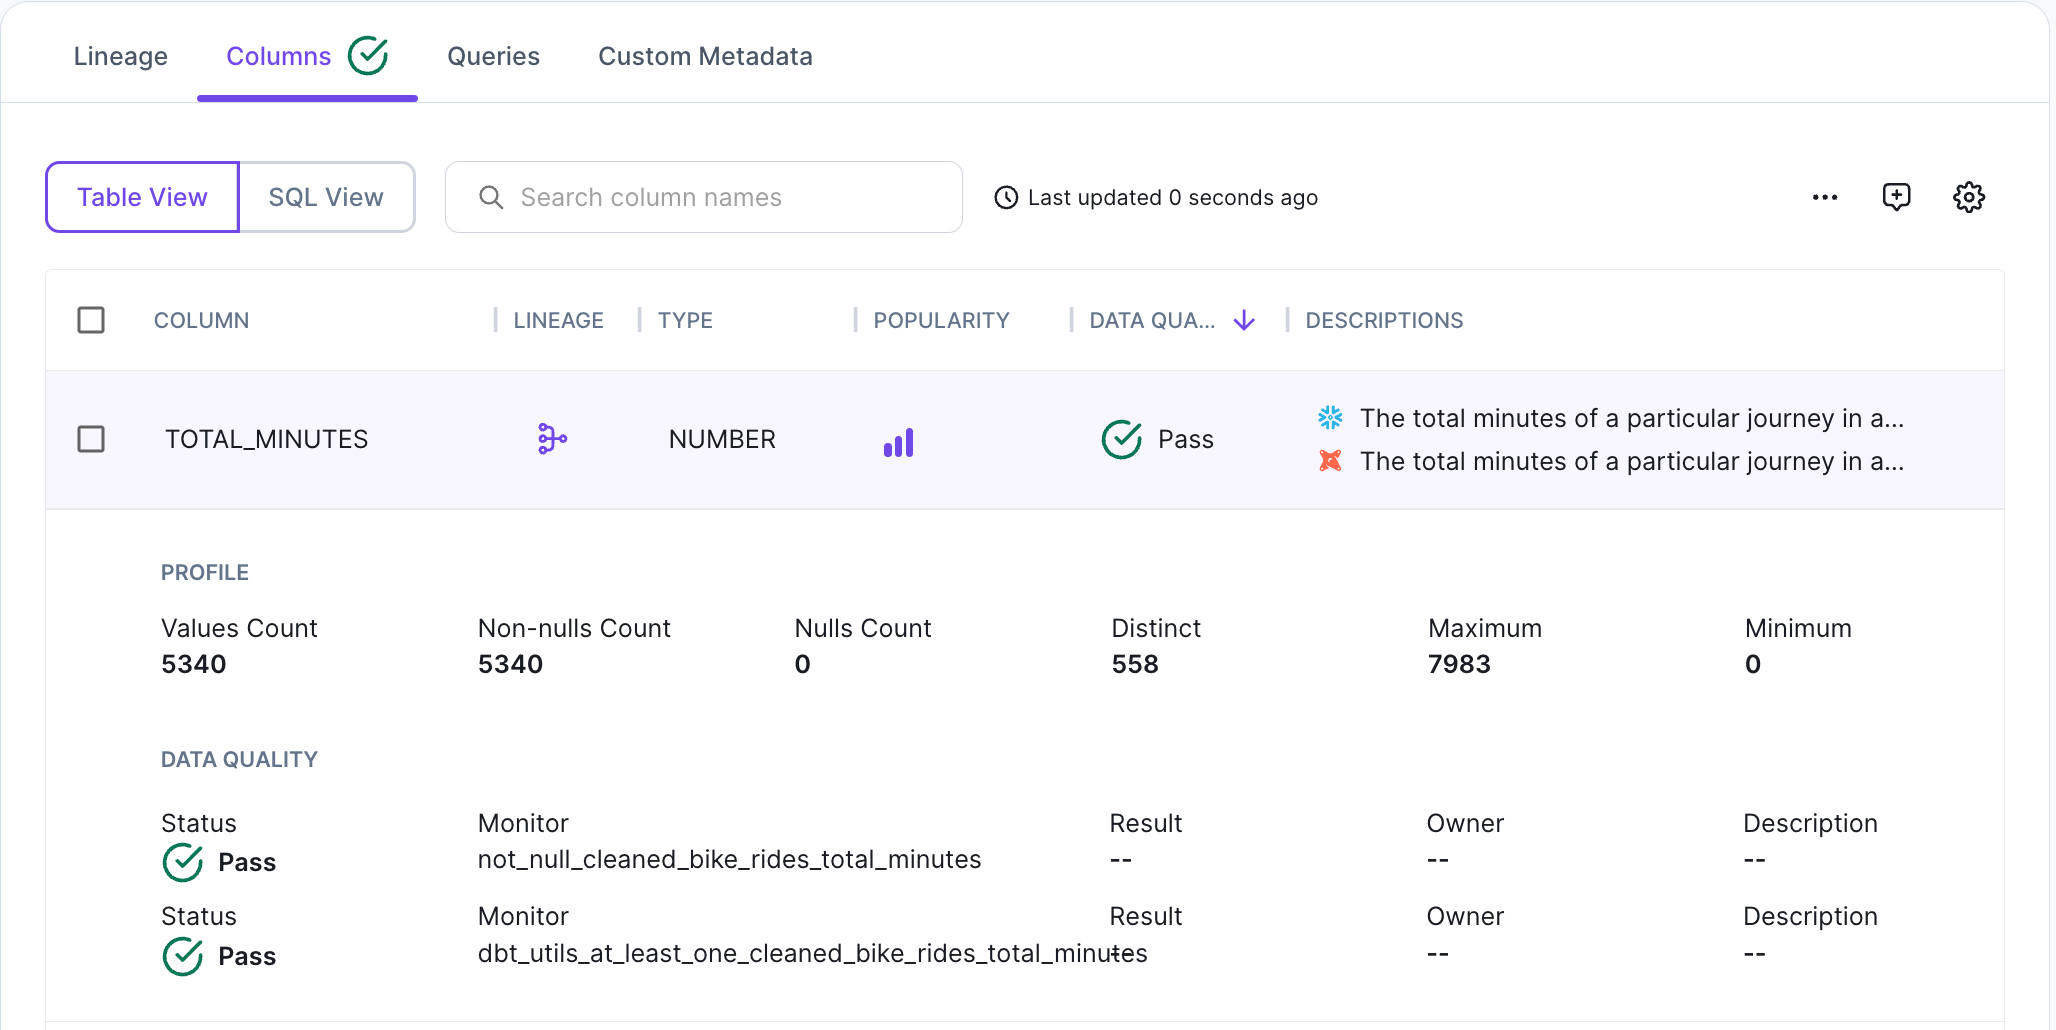
The Data Quality indicators in Metaphor have gotten a facelift. To make it easier for users to quickly see if they can trust the data in a table Metaphor now displays Green/Yellow/Red traffic indicators indicating Pass/Warn/Fail status of Quality tests.
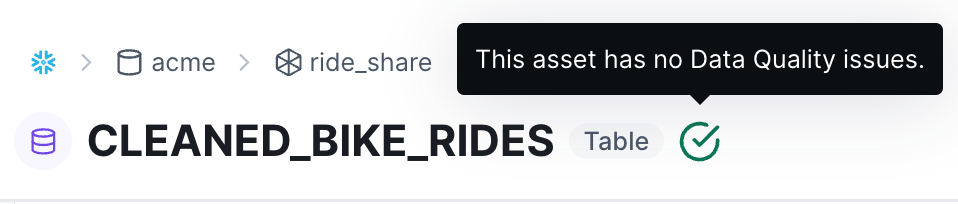
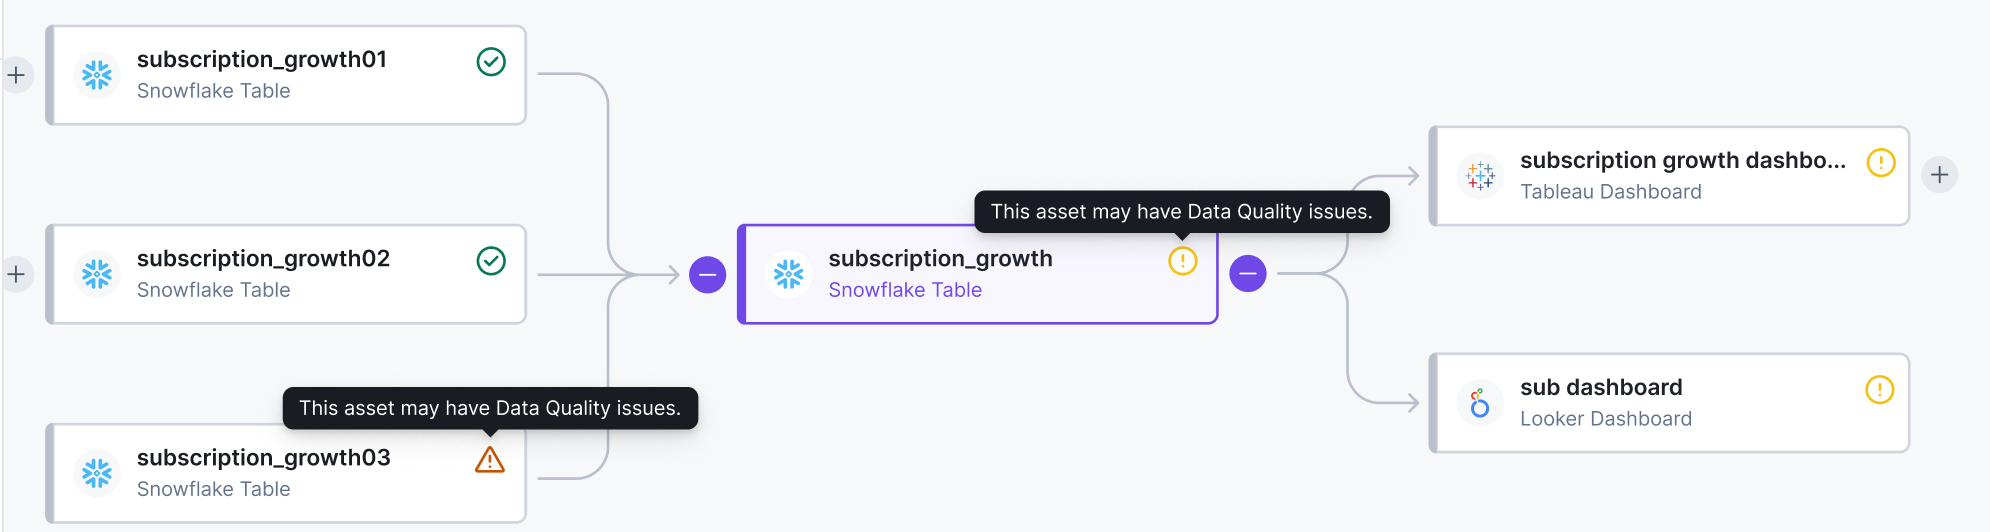
Additionally if any table has failed tests, Metaphor automatically indicates a yellow warning light to any assets that are downstream of the failed table - cautioning the user to check and see if they should still trust the data.
Like the check engine light on a car dashboard, Metaphor provides a simple indicator to the end user, warning them about potential data problems detected by sensors within the data stack.
In addition to the Data Quality/Observability tools we already integrate with e.g. MonteCarlo, Soda, we've also added integration with dbt Tests.
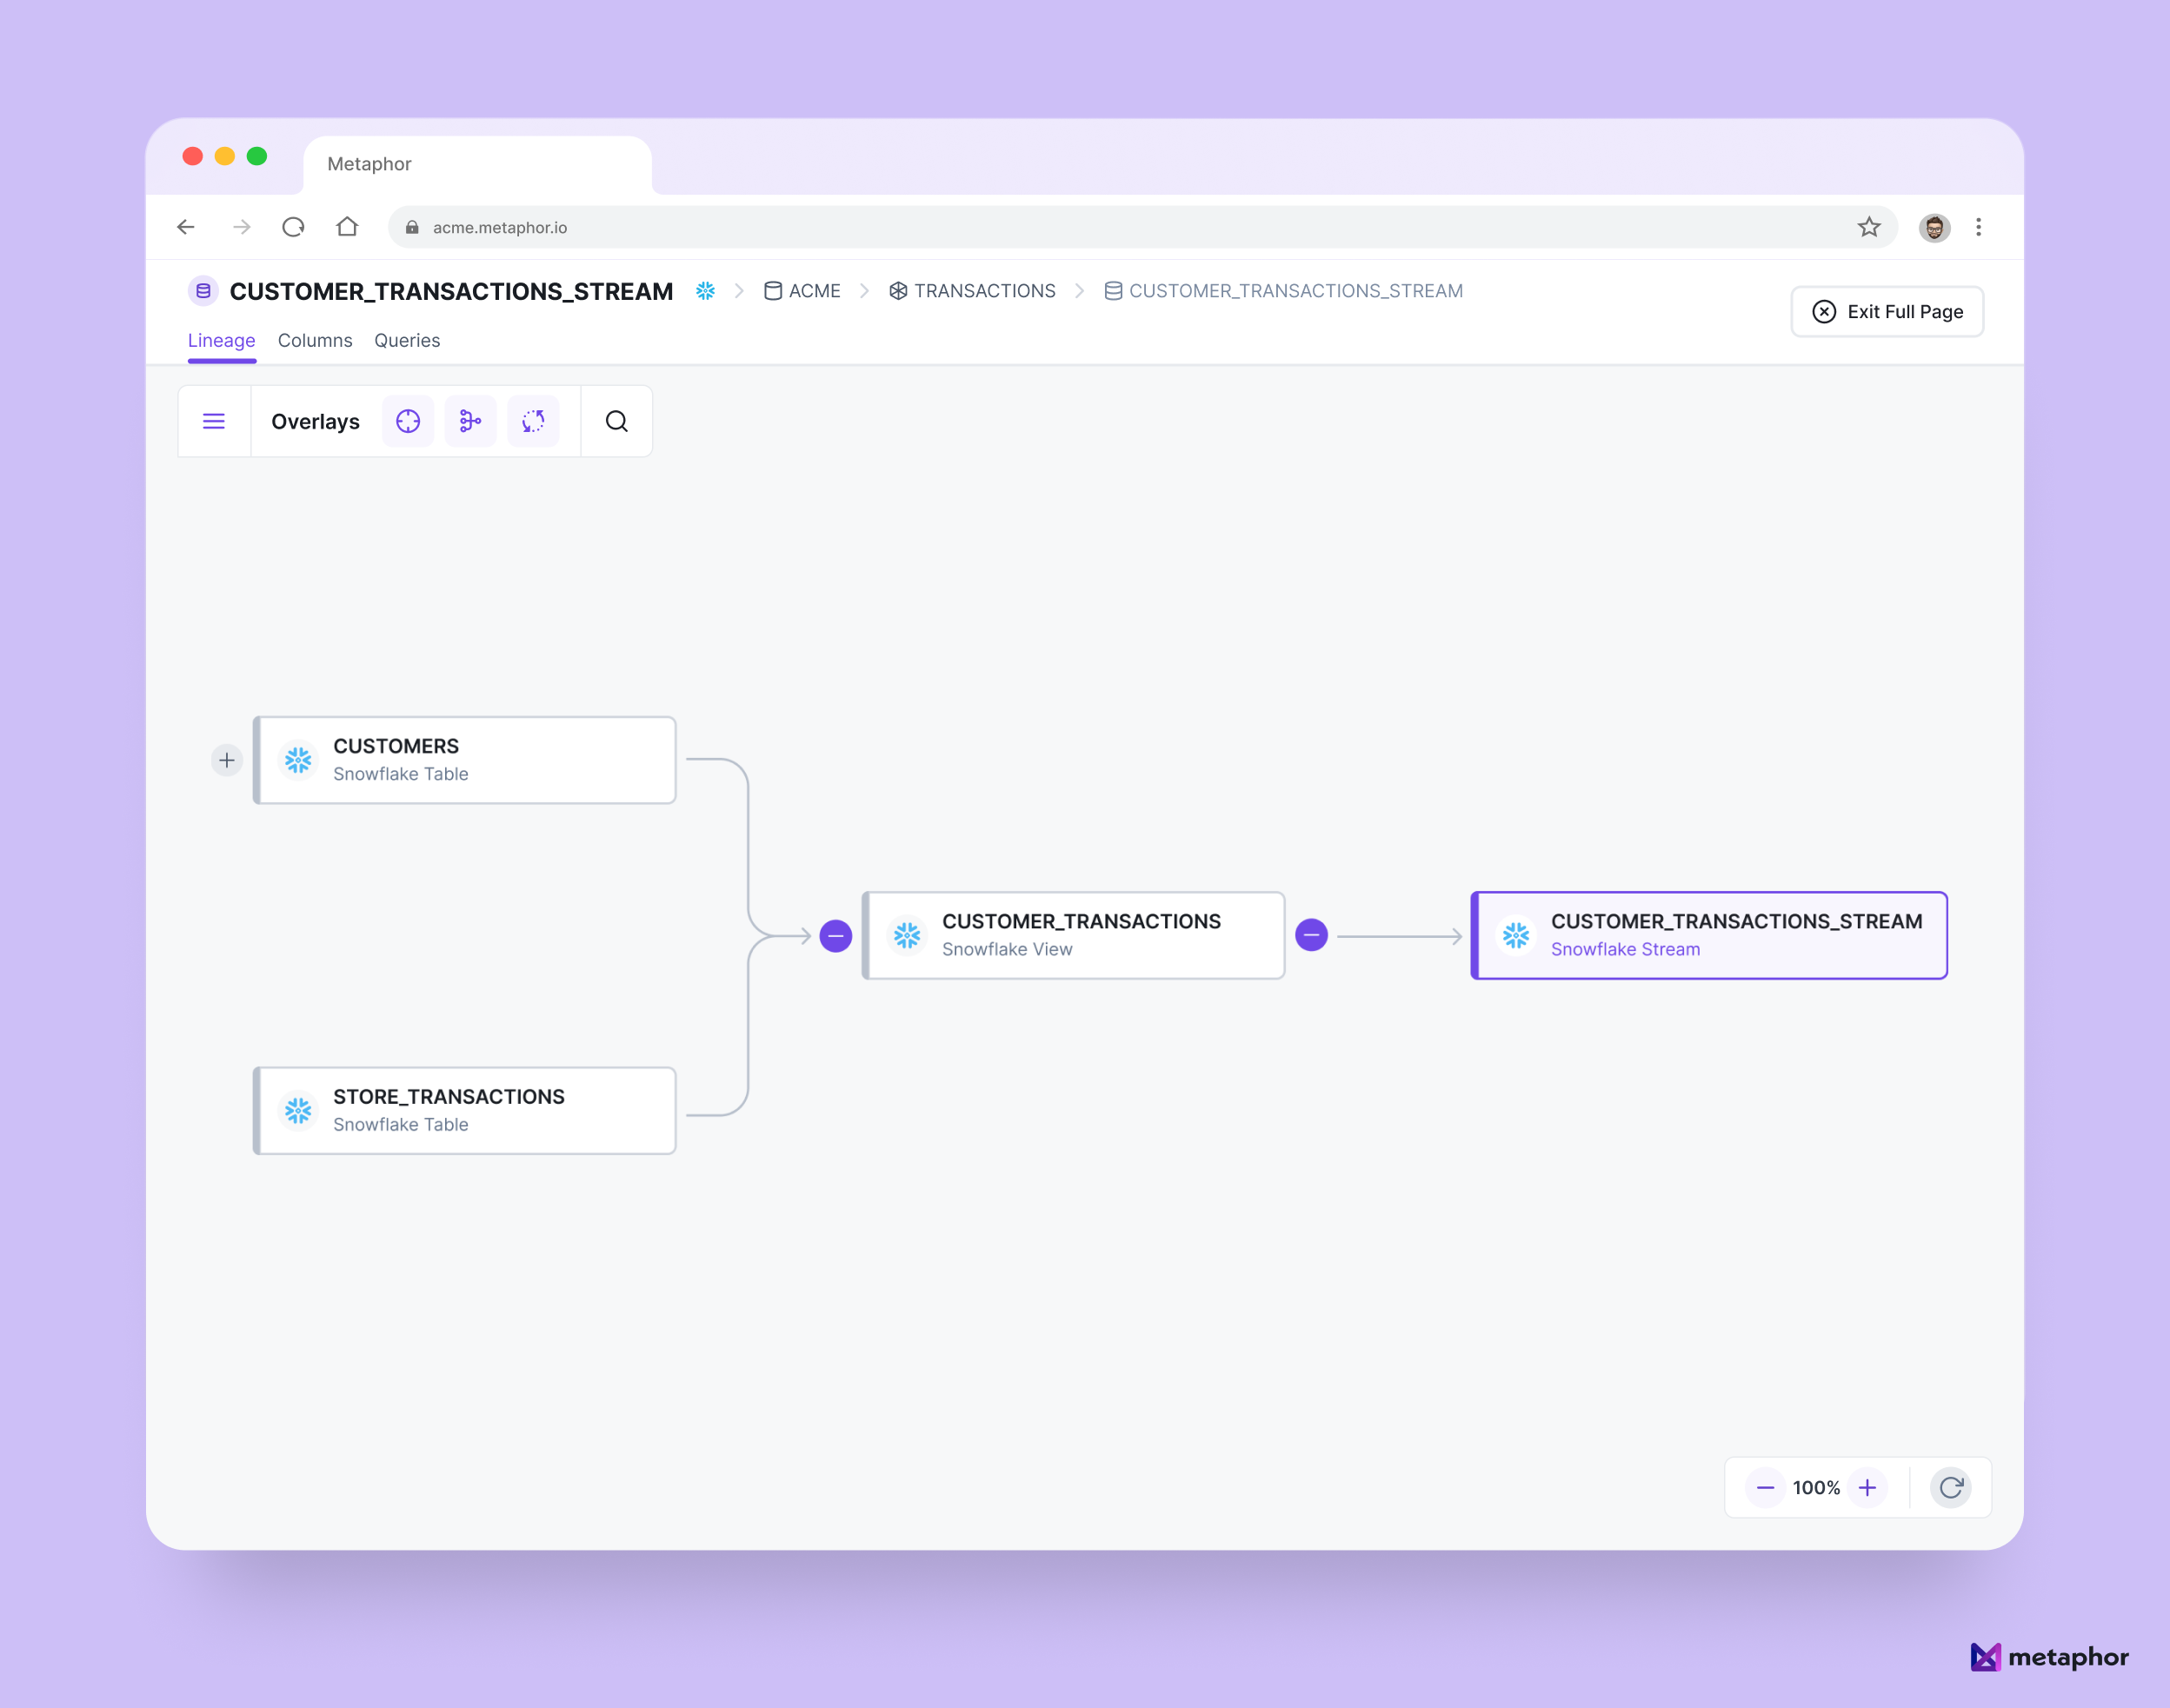
Metaphor now supports displaying Snowflake Streams as a first-class asset.
Load More
→